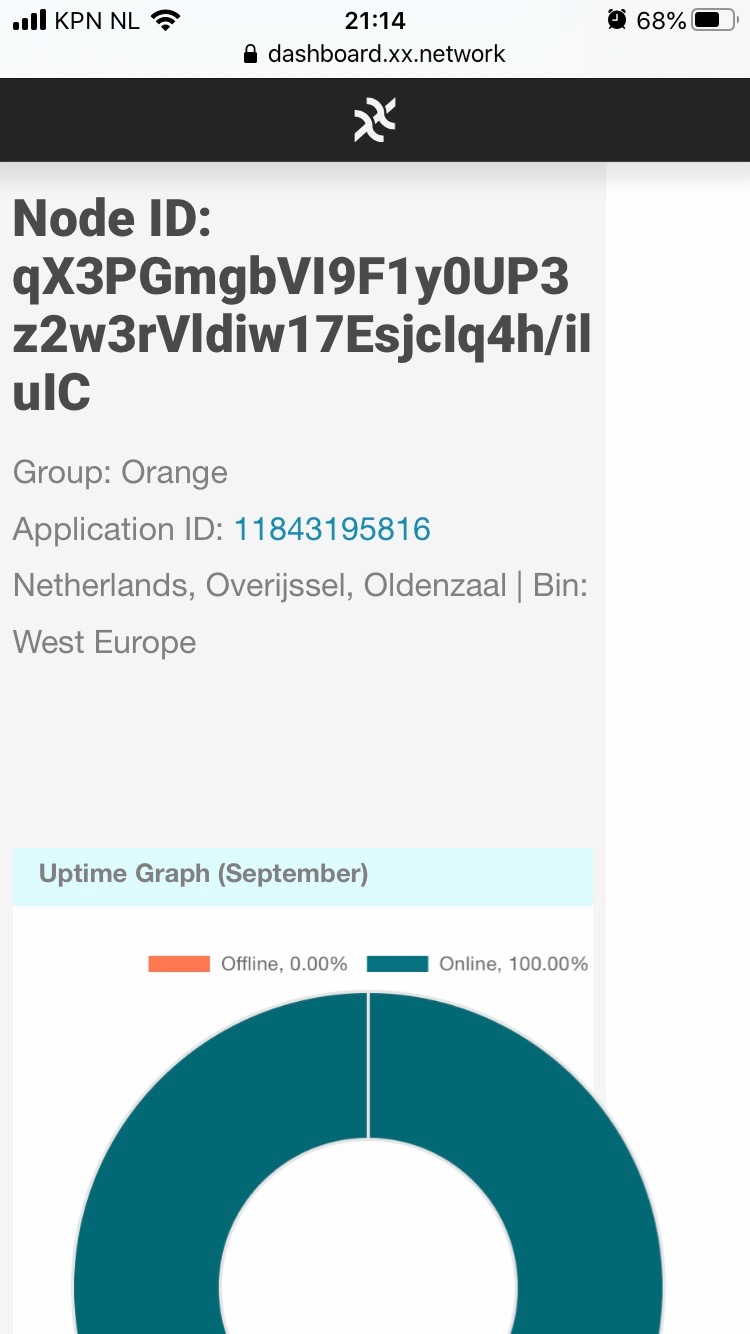
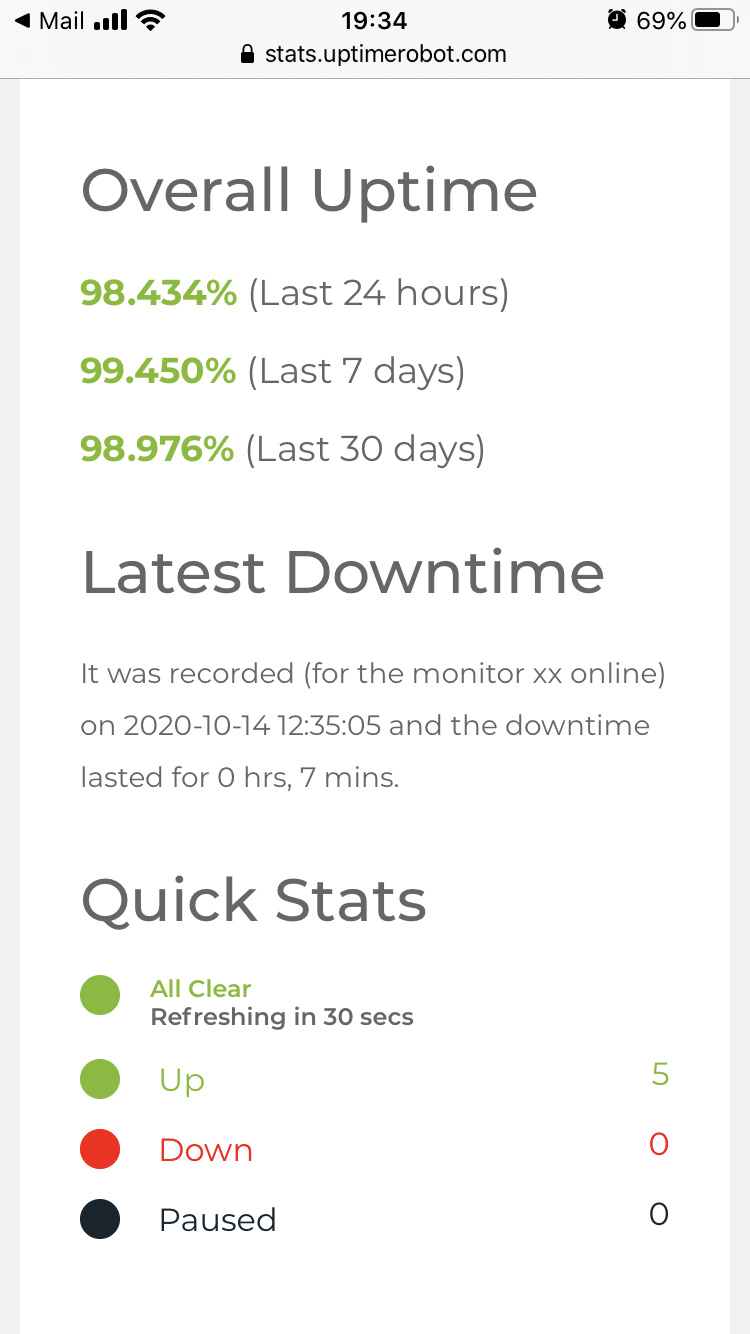
I’ve setup monitoring myself (as explained here) and it shows 100% uptime. It uses the same dashboard page which is proof it has never shown offline on the status page for my node.
The percentage shown on the dashboard is calculated from Sept. 1. Is the monitoring you set up calculated from the 1st or the 6th? I ask about the 6th because that is the day you posted the How-To.
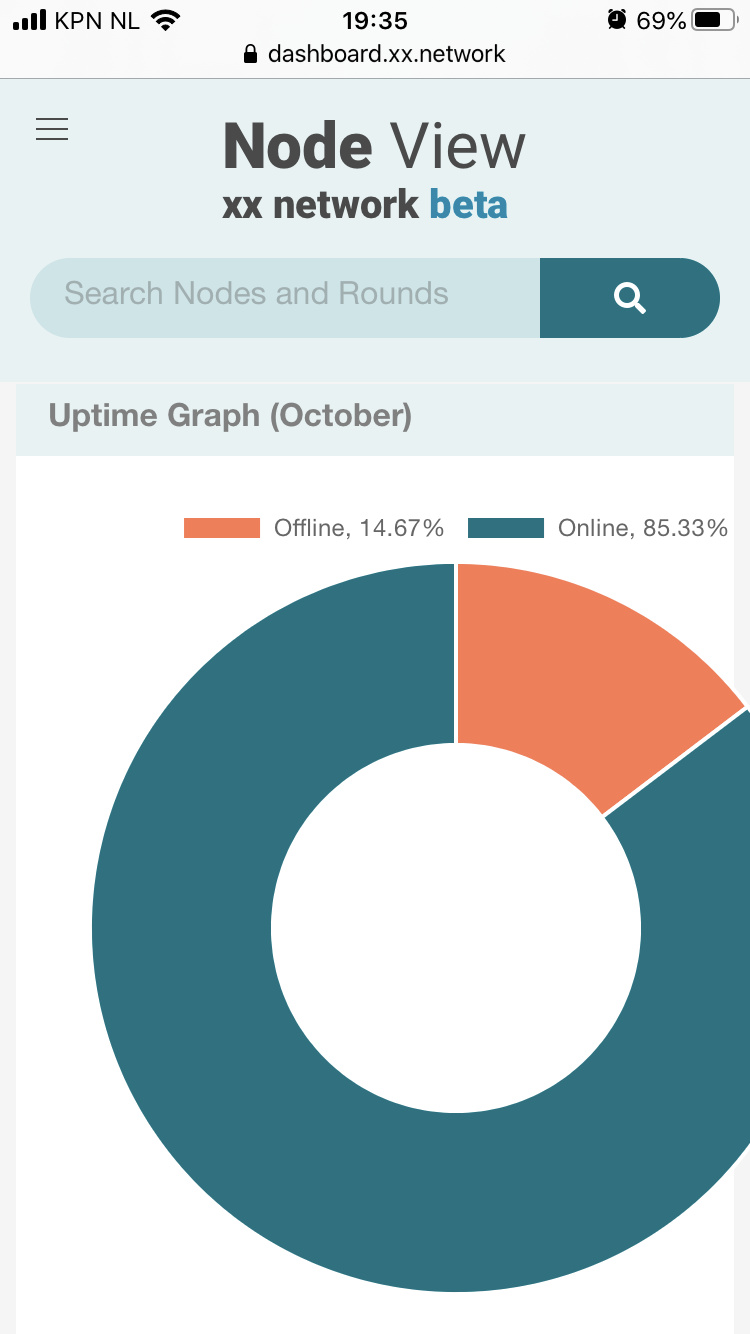
The node went online on September 5th and that’s when the monitor was started also. It started off showing 100% online for a few days and suddenly jumped down to 43% yesterday evening which seemed weird.
Didn’t know it calculated from September 1st. That would explain it then.
There was an error which will be checked again as we’re not certain if it is reoccurring. At the moment your dashboard appears to be reporting uptime correctly.